 Demo data
Overview
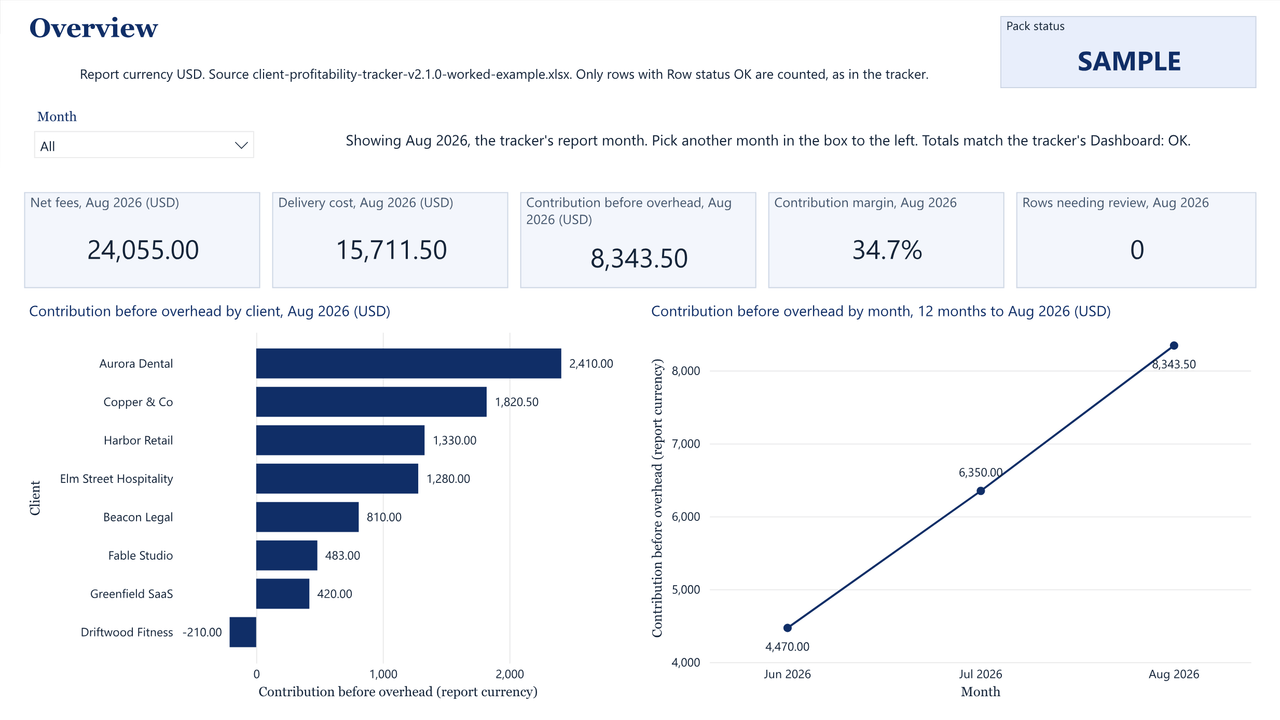
Follows the tracker's report month until you pick another.
Says whether the totals match the tracker's Dashboard.
Client Profitability Report Pack · Works with Power BI Desktop (Windows)
For agencies, studios and consultancies on Windows that keep the Client Profitability Tracker and already use Power BI Desktop.
Any range of months, 24-month trends and project drill-down, read straight from your tracker. No money maths of its own.
Screenshots from Power BI Desktop with the tracker's worked example loaded. Every client is fictional.
Open full-size image of the Overview page01What it answers
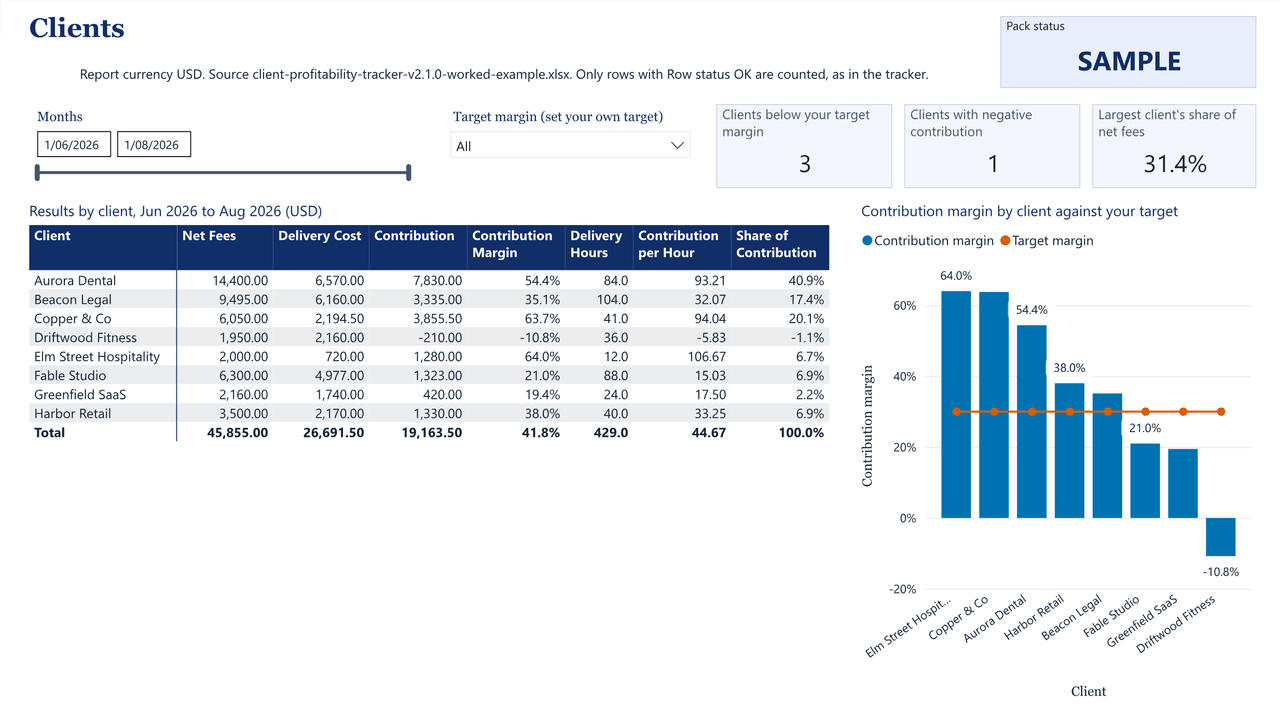
Pick any range of months and see net fees, delivery cost, contribution, margin, hours and each client's share, with a total, against a target margin you set.
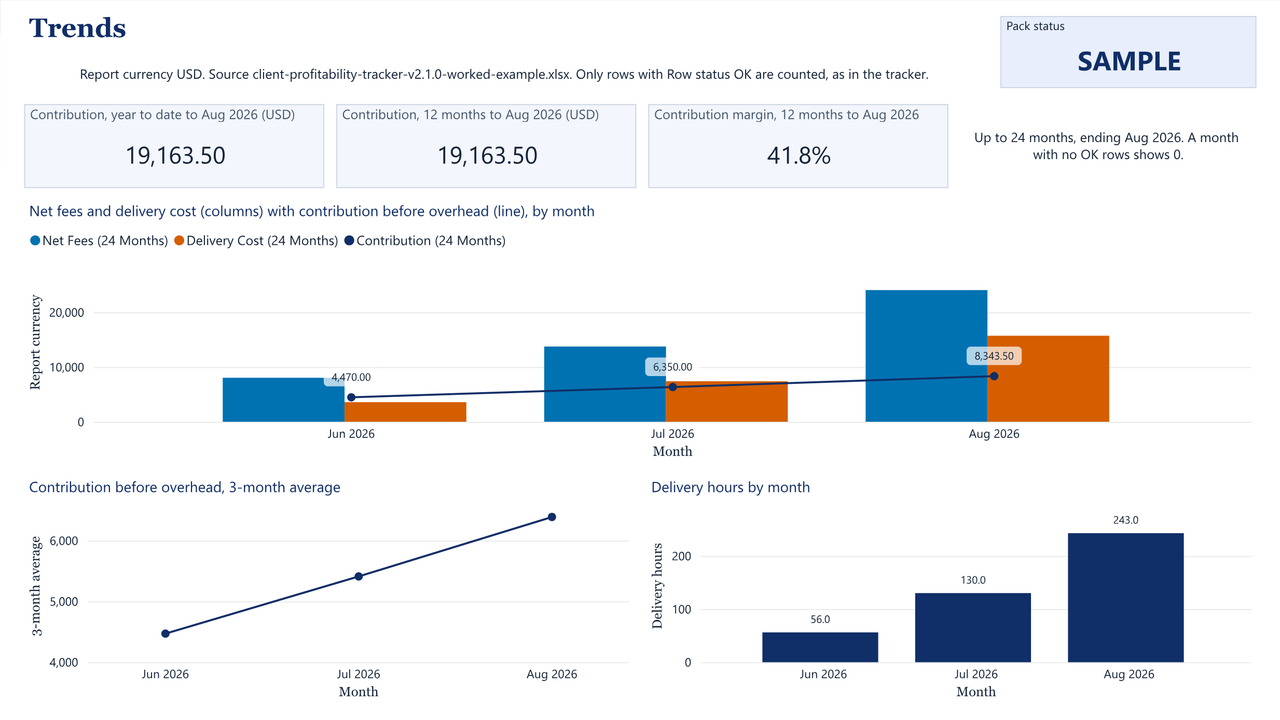
Up to 24 months of net fees and delivery cost side by side, contribution as a line, a 3-month average, hours by month, year to date and the last 12 months.
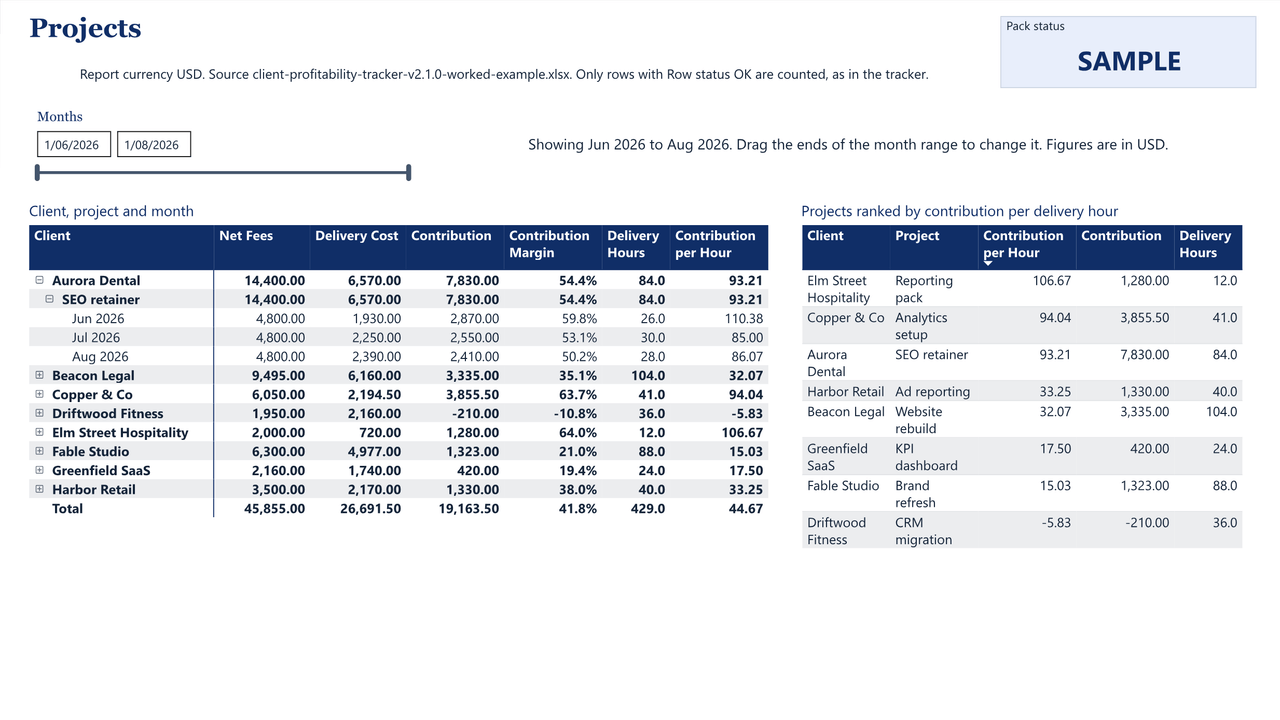
Expand from client to project to month, and rank every project by contribution per delivery hour for the months you choose.
02Demonstration
Overview. The tracker's report month: five key figures with the tracker's own labels, contribution by client and the 12 months to that month. Pick another month in the box.
Clients. Any range of months by client, with a total, and each client's margin against a target margin you set.
Trends. Up to 24 months of net fees, delivery cost and contribution, a 3-month average and hours by month.
Projects. Expand from client to project to month, and rank every project by contribution per delivery hour.
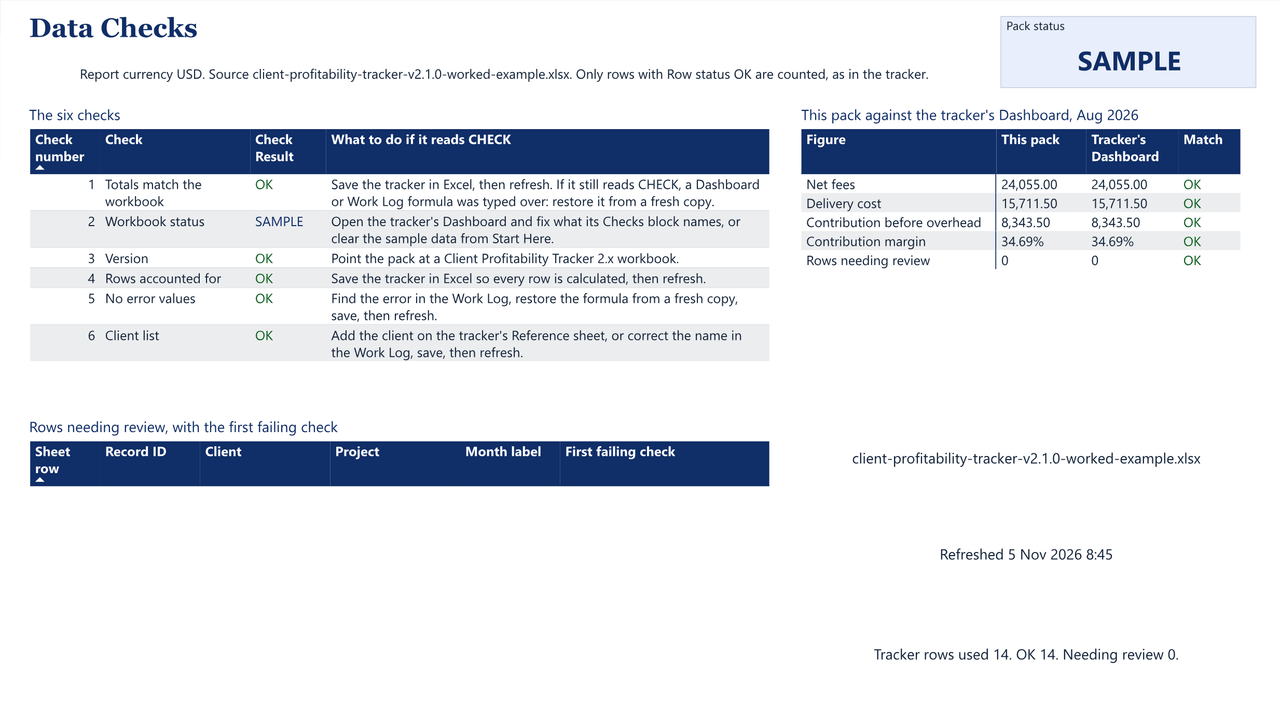
Data Checks. Six checks, the tracker's Dashboard figures beside the report's own, and every row in Review with the check it failed.
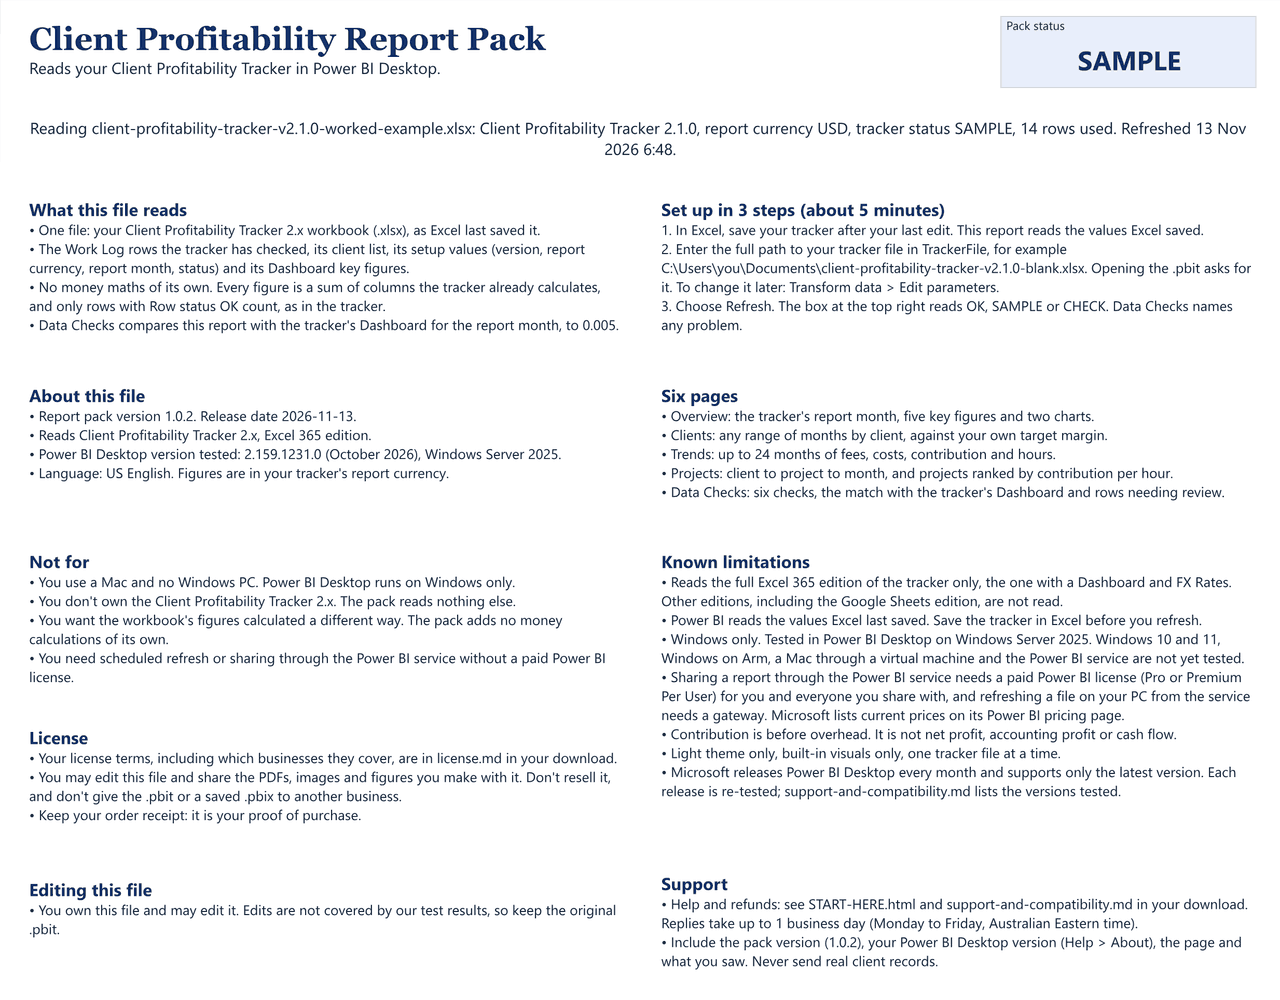
Start Here. What the report reads, three setup steps, the version, not-for, limits, license and support, and which tracker file was read.
03What's inside
Demo dataFollows the tracker's report month until you pick another.
Says whether the totals match the tracker's Dashboard.
Demo dataCounts clients below your target and clients with negative contribution.
Shows the largest client's share of net fees.
Demo dataYear to date, last 12 months and the 12-month margin.
A month with no OK rows shows 0.
Demo dataFor any range of months.
Demo dataCheck 1 compares the report with the tracker's Dashboard to 0.005.
Rows in Review are listed with their Work Log row number.
Demo dataThe status box on every page reads OK, SAMPLE or CHECK.
One ZIP file (about 101 KB), delivered by Payhip straight after payment.
| File | What it is | Size |
|---|---|---|
| pbitclient- |
The report template. Open it in Power BI Desktop; it asks for the path to your tracker | 95 KB |
| htmlSTART- |
Open this first: what each file is and where to begin | 8 KB |
| mdquick- |
Install, point the report at your tracker, refresh, and the monthly routine | 7 KB |
| mdreport- |
Every page, every measure and the six checks, in words | 16 KB |
| mdsupport- |
What it needs, where it is tested, sharing and licenses, support | 7 KB |
| mdlicense. |
The license terms | 3 KB |
| mdrelease- |
What is in this version | 6 KB |
| mdmoney- |
The 30-day money-back guarantee | 1 KB |
| txtMANIFEST- |
Checksums to verify your download | 1 KB |
04Setup
Save your tracker in Excel the report reads the values Excel saved, so save after your last edit.
About 1 minute.Open the template and paste the path double-click the .pbit in Power BI Desktop and paste the full path to your tracker when it asks.
About 2 minutes.Load, then read the status box OK, SAMPLE or CHECK on every page. Save the report as a .pbix and choose Refresh each month.
About 2 minutes.Estimate, with Power BI Desktop already installed. Installing it is a free download from Microsoft.
05Worked example
Fictional example
Point the report at the worked example that comes with the tracker. The status box reads SAMPLE, because sample rows remain. Overview shows Aug 2026, the tracker's report month: net fees 24,055.00, delivery cost 15,711.50 and contribution before overhead 8,343.50 USD, a 34.7% margin, the same figures as the tracker's Dashboard. Data Checks lists the five figures side by side. Across all three months, contribution is 19,163.50 USD on 45,855.00 of net fees, and Aurora Dental's 14,400.00 is 31.4% of net fees.
| Net fees | 24,055.00 |
|---|---|
| Delivery cost | 15,711.50 |
| Contribution before overhead | 8,343.50 |
| Contribution margin | 34.7% |
| Jun 2026 contribution | 4,470.00 |
|---|---|
| Jul 2026 contribution | 6,350.00 |
| Aug 2026 contribution | 8,343.50 |
| Year to date | 19,163.50 |
The worked example's clients are fictional and the figures are not a customer result. The report shows exactly what your tracker calculates.
06Fit
07Tested on
Each release is tested against written checks, and the results are listed here and on the compatibility page. "Not yet tested" means exactly that: it may work, but we haven't confirmed it.
Latest test run
| Environment | Status | Checks | Version and build | Last tested | Notes |
|---|---|---|---|---|---|
| Power BI Desktop, installer edition, Windows Server 2025 | Tested with notes | 36/37 passed, 1 not yet run | Report pack 1.0.2 · Power BI Desktop 2.159.1231.0 (October 2026, installer edition) · Windows Server 2025 Standard 10.0.26100 | Nov 13, 2026 | The queries were also run against 20 test cases in Excel 365's Power Query, the engine Power BI Desktop uses. 1 check needs a person at the screen and had not been run on the release date: the Windows contrast theme check. The optional 10-minute setup test is not counted. |
| Power BI Desktop, Microsoft Store edition | Not yet tested | — | — | — | Not yet tested. |
| Power BI Desktop, Windows 10 and 11 | Not yet tested | — | — | — | Not yet tested. |
| Power BI Desktop, Windows on Arm | Not yet tested | — | — | — | Not yet tested. |
| Mac through Parallels Desktop or Windows 365 | Not yet tested | — | — | — | Not yet tested. Microsoft names these as the ways to run Windows apps on an Apple-silicon Mac. |
| Power BI service (publish, share, refresh) | Not yet tested | — | — | — | Not yet tested. Sharing there needs a paid Power BI license for you and every viewer. |
| Mac without Windows | Not supported | — | — | — | Power BI Desktop runs on Windows only. |
A free update for everyone who bought 1.0.0 or 1.0.1, through the same Payhip download link. The same tracker file gives the same checks as in 1.0.1, and the same figures apart from one case on Overview. Reports you saved from 1.0.0 or 1.0.1 keep working.
Inputs affected: No. The report never changes your tracker.
08What you get
Each purchase includes the files above, updates, email support and a license for your business.
09License
Two licenses. Both let you edit the report, keep backups and share PDFs and figures from it. Neither lets you pass the template or a saved report to another business.
included at US$29
For one business or sole trader, and everyone who works in it: staff and contractors.
30-day money-back guarantee. No questions asked.
Store-wide
For an agency and up to 5 client businesses it manages, and everyone who works in the agency.
Agency/Team is store-wide: the Client Profitability Tracker's US$99 Agency/Team license, or the Agency Operating Bundle's US$129 Agency/Team tier, covers every Metricvalley business template your business owns, including this report pack. The report pack has no Agency/Team price of its own.
The full terms are in the download and shown before checkout. Power BI Desktop and any Power BI license come from Microsoft under Microsoft's terms. Nothing in our terms limits rights you have under consumer law. Read the full license terms.
10Guarantee
If the report pack isn't right for your business, email [email protected] within 30 days of purchase with your order number. You'll get a full refund to your original payment method. No questions asked and no forms to fill in; we only ask that you delete your copies. This guarantee is in addition to your rights under the Australian Consumer Law and any other consumer law that applies to you.
11FAQ
Not to use the report on your own PC. Power BI Desktop is a free download from Microsoft, and the report opens, refreshes and shows every page without a Power BI account. Publishing to the Power BI service and sharing there needs a paid Power BI license (Pro or Premium Per User) for you and everyone you share with; Microsoft lists current prices on its Power BI pricing page.
No. Power BI Desktop runs on Windows only. Microsoft names Parallels Desktop and Windows 365 as ways to run Windows on an Apple-silicon Mac, but we haven't tested the report that way.
They shouldn't, and the report checks. It sums the same stored values the tracker's own totals sum, over the same OK rows, and check 1 compares its figures with the tracker's Dashboard for the report month, to 0.005. If you edit the tracker and don't save it in Excel, the report shows the last saved figures.
The full Excel 365 edition of the Client Profitability Tracker 2.x: your copy of the blank or of the worked example. Not the free lite edition, the Etsy Starter edition or the Google Sheets edition. A file it can't read gets one plain sentence on Start Here, never partial figures.
Yes. You own the file and may edit it. Build from the measures in the Pack Measures table: they already apply the tracker's OK-row rule. Your edits aren't covered by our test results, so keep the original .pbit.
No. The bundle holds the four agency tools. The report pack is sold on its own at US$29, and an Agency/Team license from the tracker or the bundle covers it too.
Every purchase has a 30-day money-back guarantee. Email support within 30 days with your Payhip order number. You get a full refund to your original payment method.
More answers in the setup guide and the help center.